Protein-Ligand
Interaction calculation
To calculate interactions between a ligand and residues of a protein, you use:
python surface_cont_lig.py -f pdb_file.pdb -c ABC -lig LIG -o csv_output.csv -def atomtypes_definition.def -dat atomtypes_interactions.dat
that will provide a calculation of the interactions between residues of the group of chains (A, B and C in the example) and atoms of the ligand (LIG in the example).
Visual output
To generate a pymol session visually presenting the calculated results, you might use:
python image_surfaces_lig.py -f pdb_file.pdb -c csv_output.csv -o pymol_session_output.pse
or utilize extra customizations that are better explained at Customizations.
Example application
For the protein-ligand application we will use a structure of the SARS-CoV-2 papain-like protease (PLpro) and the ligand Proflavin (PRL) (PDB ID 7NT4), reported to have inhibitory effects. With this function of Surfaces we will be able to rapidly assess the specific interactions of this complex, allowing the study of the binding pocket and possible mechanisms of inhibition.
The initial step is to update the atom type definitions file with the atoms of the ligand PRL. For that you will create a .pdb file containg only the ligand of interest and evaluate the atom types of the atoms in this .pdb file, like described at Preprocessing:
python create_lig_file.py -f 7NT4.pdb -lig PRL
python ligand_atomtypes.py -pdb PRL.pdb -def AMINO_FlexAID.def
This last step depends on importing pymol in order to convert the .pdb file to ./mol2 format and get the atom types for each ligand atom. In case you wish to not rely on the pymol library, you have the option to already use the .mol2 file as input:
python ligand_atomtypes.py -mol2 PRL.mol2 -def AMINO_FlexAID.def
The file custom_AMINO_FlexAID.def now contains updated atom type definitions that include the atoms of PRL.
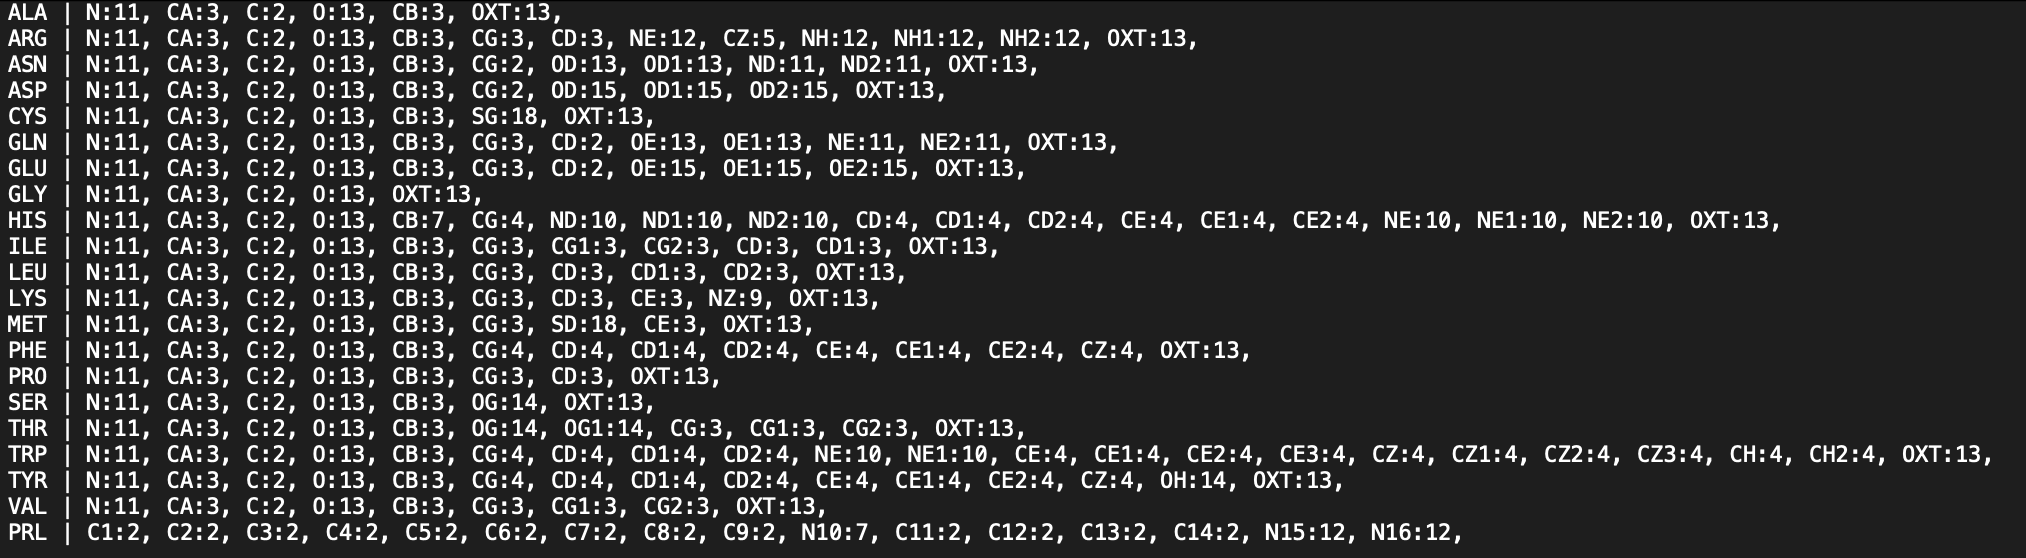
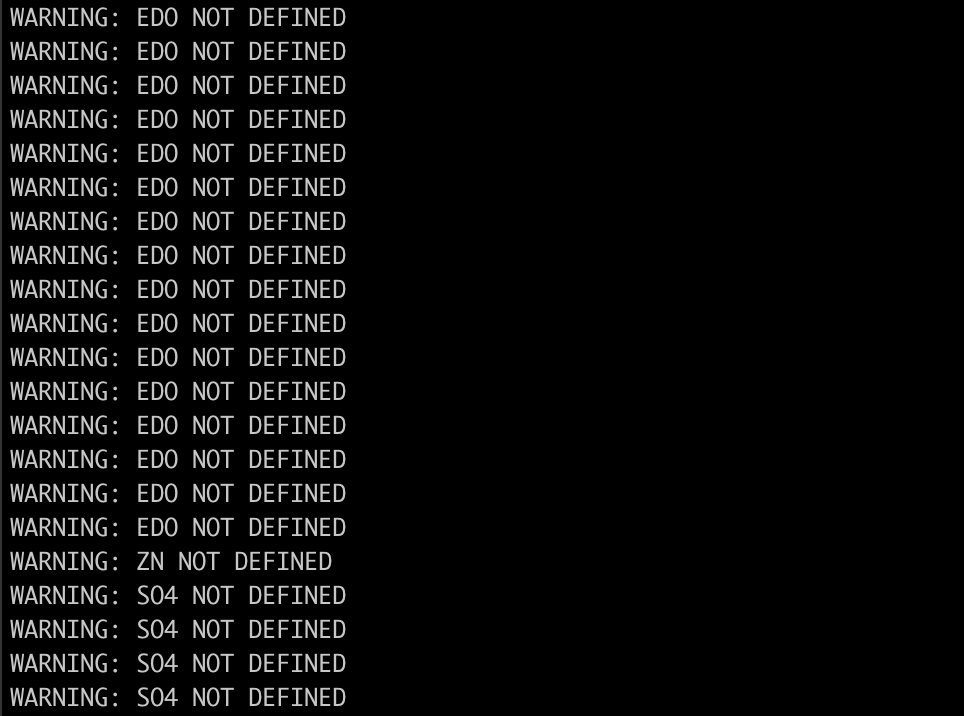
The following step is to clean the structure from any non-defined atom in the now updated .def file, meaning any atom that is not defined for the 20 residues or the PRL ligand - in the case of this example, atoms from SO4, EDO and HOH, as well as ZN atoms:
python clean_structure.py -f 7NT4.pdb -def custom_AMINO_FlexAID.def
And you have created the clean version of the .pdb file named clean_7NT4.pdb.
Now it’s time to evaluate interactions:
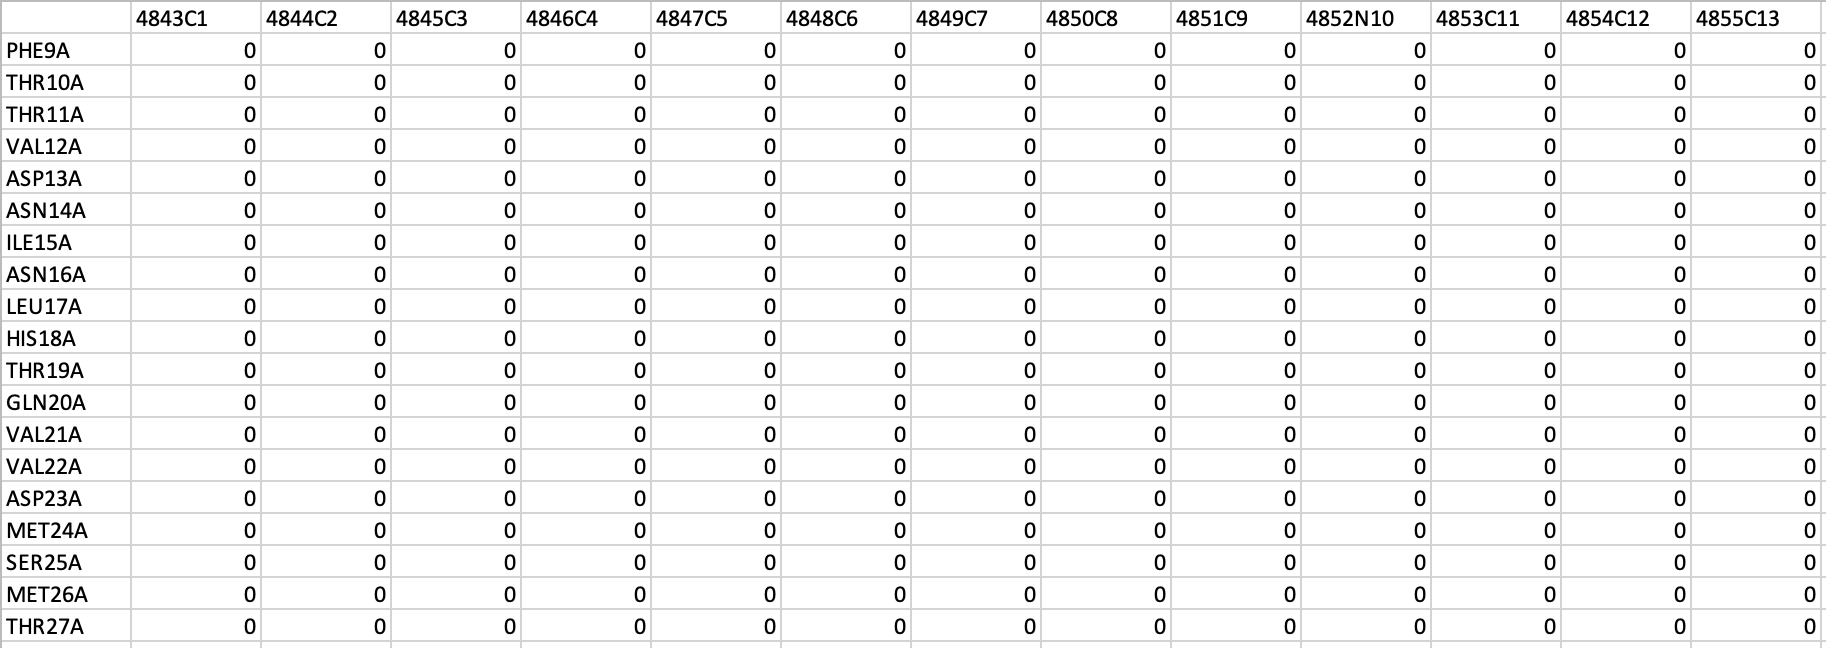
python surface_cont_lig.py -f clean_7NT4.pdb -c AB -lig PRL -o 7NT4_output.csv -def custom_AMINO_FlexAID.def -dat FlexAID.dat
In which the chains (A and B) are the chains of the protein and the ligand (PRL) is the ligand of interest, already defined in the custom .def file (custom_AMINO_FlexAID.def). Once this step is done, you have created the output file 7NT4_output.csv with the pairwise interactions between residues from PLpro and atoms from Proflavin - this file mostly consists of zeros because most pairs are not interacting -, as well as the file List_7NT4_output.txt, with a list of the existing interactions ranked by absolute value.

To map this evaluation back to the structure and visually check your results, you can run:
python image_surfaces_lig.py -f clean_7NT4.pdb -c 7NT4_output.csv -o 7NT4_visual_output.pse -cs_range [-0.35,0.35]
Now you have a representation of your results in the pymol session 7NT4_visual_output.pse. All the existing interactions are represented as objects and saved as enabled objects - to change that, check the Customizations page. The color scale goes from red for unfavorable interactions, to blue for the favorable ones, and was customized to the range of -0.35 to 0.35 - as also described at Customizations.

Tip
You can also run the visual output step inside the Pymol interface and avoid issues with the Pymol API. For that, you must install the dependencies inside the Pymol environment:
cd Surfaces
pip install -r dependencies.txt
Run the pymol_image_surfaces.py script either using the interface button or directly from the Pymol prompt:
run pymol_image_surfaces_lig.py
And then use the generate_session function:
generate_session("clean_7NT4.pdb","7NT4_output.csv",color_scale_range=[-0.35,0.35])