Protein-Protein
Interaction calculation
To calculate pairwise interactions between residues of different strutural units, you use:
python surface_cont.py -f pdb_file.pdb -c1 ABC -c2 DE -o csv_output.csv -def atomtypes_definition.def -dat atomtypes_interactions.dat
that will provide a calculation of the interactions between residues of the first group of chains (A, B and C in the example) and residues of the second group of chains (D and E in the example).
Visual output
To generate a pymol session visually presenting the calculated results, you might use:
python image_surfaces.py -f pdb_file.pdb -c csv_output.csv -o pymol_session_output.pse
or utilize extra customizations that are better explained at Customizations.
Example application
For our protein-protein application we will utilize a structure of Spike, a viral glycoprotrein, in complex with nanobodies (PDB ID 7VQ0). The study of epitopes is a very important field, and with the following scripts we are able to assess the particular viral residues and interactions that might be important for immune recognition.
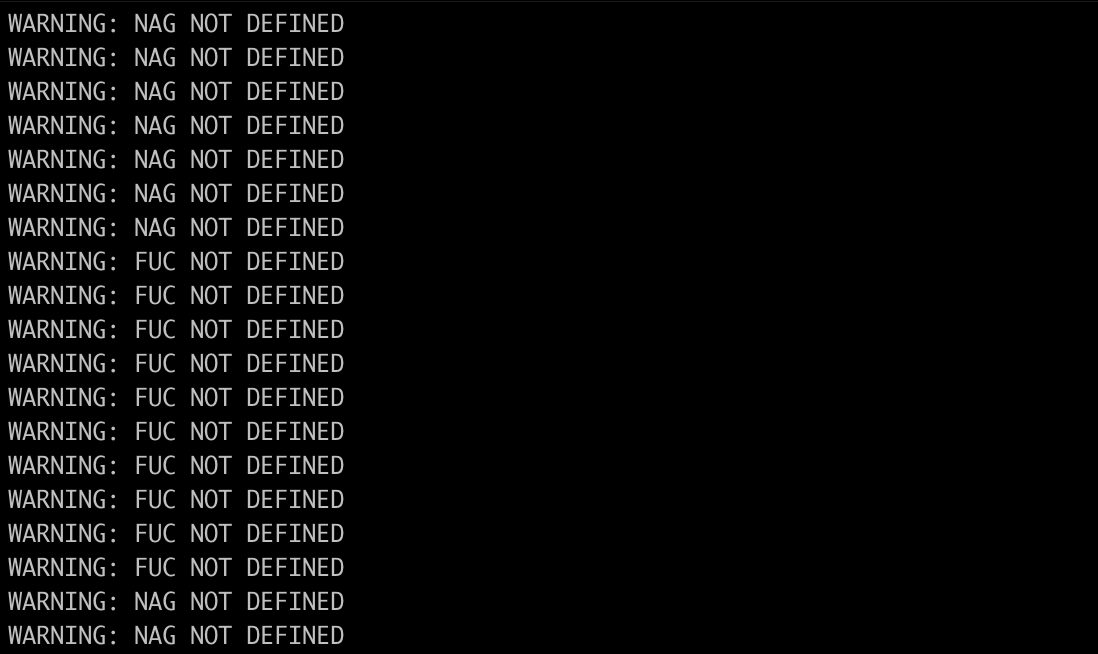
First we need to clean the structure from any non-defined atom, such as heteroatoms - in the case of this example, NAG, MAN and FUC atoms:
python clean_structure.py -f 7VQ0.pdb -def AMINO_FlexAID.def
Once this step is done, you will have created the clean_7VQ0.pdb file.
Now it’s time to evaluate interactions:
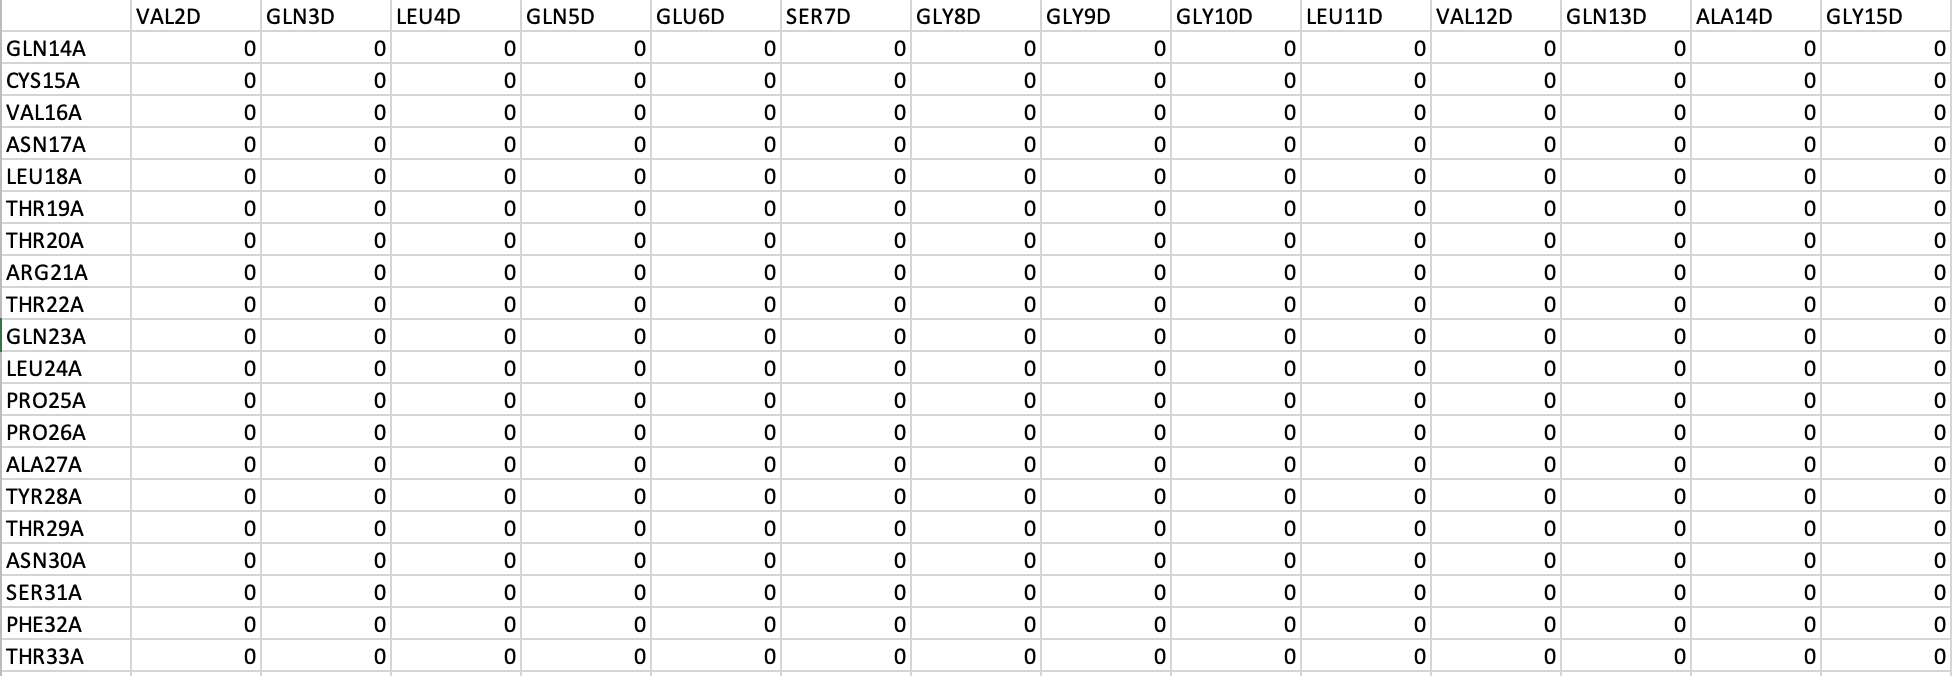
python surface_cont.py -f clean_7VQ0.pdb -c1 ABC -c2 DEF -o 7VQ0_output.csv -def AMINO_FlexAID.def -dat FlexAID.dat
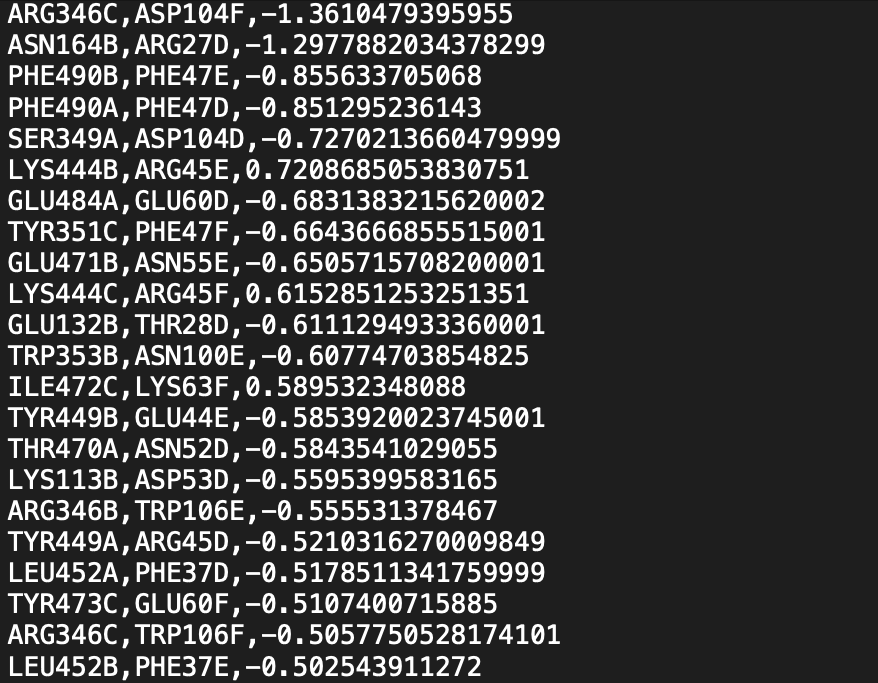
In which the first group of chains (A, B and C) are chains from the Spike protein and the second group (D, E and F) are units of the nanobody P86. And now you have created the output file 7VQ0_output.csv with the pairwise interactions of residues from Spike and residues from the nanobodies - this file mostly consists of zeros because most pairs are not interacting -, as well as the file List_7VQ0_output.txt, with a list of the existing interactions ranked by absolute value.
To map this evaluation back to the structure and visually check your results, you can run:
python image_surfaces.py -f clean_7VQ0.pdb -c 7VQ0_output.csv -o 7VQ0_visual_output.pse
Now you have a representation of your results in the pymol session 7VQ0_visual_output.pse. All the existing interactions are represented as objects, but only the 10% most numerically relevant ones are saved as enabled objects - to change that, check the Customizations page. The color scale goes from red for unfavorable interactions, to blue for the favorable ones, and is automatically determined based on the largest absolute value - which is also Customizable.

Tip
You can also run the visual output step inside the Pymol interface and avoid issues with the Pymol API. For that, you must install the dependencies inside the Pymol environment:
cd Surfaces
pip install -r dependencies.txt
Run the pymol_image_surfaces.py script either using the interface button or directly from the Pymol prompt:
run pymol_image_surfaces.py
And then use the generate_session function:
generate_session("clean_7VQ0.pdb","7VQ0_output.csv")